Lately I’ve been trailing a new system.
It’s not super scientific, as is the case with pretty much everything I do. Instead it’s based on cold, hard feelings 🙂
A while back I had this light bulb moment. As I sucked so bad on my last FTP (well, 4DP) test, how would I fare if I switched to doing FTP tests every few rides?
It is as sadistic as it sounds.
However, there is some method to my madness.
The theory I have is that if I keep doing these tests, a few things should happen:
- I get used to riding flat out for 20+ minutes;
- As my body adapts to that specific type of riding, I should start to see gains;
- When I actually do the FTP test, it won’t be as daunting
And so that is what I’ve been doing. Rather than letting the thoughts of an upcoming FTP test fill me with anxiety, I have pulled the old switcheroo and started doing them almost every other ride.
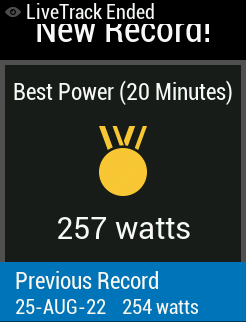
Amazingly, I actually PB’d my 20 minute effort today.
I know it’s difficult to properly do a timed test outdoors, but I gave it everything today. Could it have been better indoors? I’m going to say … maybe.
There are three places I had to slow down on this route, but I was fortunate not to encounter traffic at any, and I remembered to stay seated when getting back on the gas.
The biggest surprise for me during this one was just how many times I looked down and saw myself over 4w/kg. Not always, let’s be real. But I was able to sustain a really high average wattage through sheer grit and determination.
Maybe that utter shambles of a performance was just what I needed to give myself the kick up the arse to start rising up from the year’s performance plateau?
They say a picture is worth a thousand words. Well, I don’t have any pictures from this one.
What I do have is a table. And a table must be worth at least 750 words? No?
Well, here it is anyway. Lap 2 is the one that’s important:
| Laps | 1 | 2 | 3 |
| Time | 7:29.2 | 20:13 | 21:31 |
| Cumulative Time | 7:29.2 | 27:42:00 | 49:13:00 |
| Distance | 3.38 | 12.16 | 9.32 |
| Avg Speed | 27.1 | 36.1 | 26 |
| Avg HR | 147 | 179 | 156 |
| Max HR | 168 | 186 | 186 |
| Total Ascent | 33 | 32 | 72 |
| Total Descent | 17 | 34 | 68 |
| Avg Bike Cadence | 86 | 92 | 78 |
| Max Bike Cadence | 112 | 109 | 102 |
| Normalized Power® (NP®) | 200 | 257 | 191 |
| Balance Left (%) | 52 | 50 | 52 |
| Balance Right (%) | 48 | 50 | 48 |
| Avg Power | 174 | 257 | 157 |
| Avg W/kg | 2.56 | 3.78 | 2.31 |
| Max Power | 742 | 430 | 615 |
| Max W/kg | 10.91 | 6.32 | 9.04 |
| Max Avg Power (20 min) | — | — | — |
| Total Standing Time | — | — | 01:07 |
| Avg Standing Power | — | — | 269 |
| Max Standing Power | — | — | 395 |
| Total Seated Time | — | — | 20:24 |
| Avg Seated Power | 173 | 257 | 151 |
| Max Seated Power | 742 | 430 | 615 |
| L Power Phase Start Angle | 340 | 346 | 349 |
| L Power Phase End Angle | 200 | 208 | 204 |
| R Power Phase Start Angle | 347 | 350 | 354 |
| R Power Phase End Angle | 198 | 203 | 203 |
| L Power Phase Arc Length | 218 | 221 | 214 |
| R Power Phase Arc Length | 210 | 211 | 207 |
| L Peak Power Phase Start Angle | 60 | 63 | 56 |
| L Peak Power Phase End Angle | 128 | 124 | 134 |
| R Peak Power Phase Start Angle | 60 | 62 | 58 |
| R Peak Power Phase End Angle | 128 | 124 | 136 |
| L Peak Power Phase Arc Length | 68 | 60 | 77 |
| R Peak Power Phase Arc Length | 68 | 62 | 79 |
| L PCO Average | 0 | 0 | 0 |
| R PCO Average | 0 | 0 | 0 |
| Calories | 88 | 339 | 233 |
| Avg Temperature | 21 | 20 | 20 |
| Max Speed | 43.9 | 42.7 | 54.4 |
| Moving Time | 07:29 | 20:13 | 21:08 |
| Avg Moving Speed | 27.1 | 36.1 | 26.5 |
I’m really pleased with this.
It shows really early signs of progress.
Yes, it’s a tough ride. It’s brutal. But it’s not really any different to the turbo based FTP test. Well, maybe it is in one big way – the wind dries off the copious amounts of sweat far more efficiently than any fan ever could.
The fun doesn’t stop though.
Tomorrow will be an easier ride – just tempo stuff.
And then I guess Thursday is back on with another hard push. Let’s see where the plan takes us, eh?


